A.M.C. Daviesa and Tom Fearnb
aNorwich Near Infrared Consultancy, 10 Aspen Way, Cringleford, Norwich NR4 6UA, UK. E-mail: [email protected]
bDepartment of Statistical Science, University College London, Gower Street, London WC1E 6BT, UK
Historical introduction
I first heard of “Wavelets” at the “Chambersburg” (International Diffuse Reflection) Conference in 1996. I did not understand it but thought it might be an important topic so I asked the lecturer to try to explain it again. He tried hard but I still did not get it. He said he would send me some papers. He did, but I did not understand them. Two years later at the next IDRC, Tom and I ran our “Introduction to NIR and chemometrics” short course (which we had been doing for several IDRCs) but we were also asked to present a one-day course on “Advanced Chemometrics”. We organised this by e-mail and telephone. One of the topics was to be data compression, I would talk about Fourier and Tom would cover wavelets (I still did not understand wavelets so I was especially looking forward to this part of the course). At Chambersburg, I did my bit on Fourier (very similar to the previous TD column1) and Tom began his explanation of wavelets. In less than 10 minutes, I understood! We hope you will also understand when you have read this article!—Tony Davies
Wavelets
Compared to Fourier, wavelets in their current form are a very recent development, in the late 1980s. They were invented by the Belgian mathematician Ingrid Daubechies and are described in a paper in 1992.2
In some ways wavelets are similar to the sine and cosine waves we use in Fourier transformation: they have the same mathematical properties that allow them to be used to fit spectra but they are different in two important ways. First, wavelets are not smooth curves, some have quite jagged features, and second, they are locally weighted. There are an infinite number of possible wavelet shapes but because they are difficult to invent* there are not very many. Three of those invented by Daubechies, are shown in Figure 1, they are known by the names, Daubechies extremal phase, Coiflet and Symmlet. Each of these waveforms has been subjected to minor changes and are distinguished by a number, D2–D10, C2–C5 and S2–S8, shown in Figure 2.
*The majority of mathematicians prefer the word “discover” on the grounds that all mathematics is either possible (waiting to be discovered) or not possible (cannot be discovered or invented). This may be so but it is sometimes obvious that “invent” is the appropriate word. Interestingly, after I wrote this note I discovered a website containing an interview with Ingrid Daubechies in which she said that she believes that all mathematics is “constructed” not discovered!]


We use a string of wavelets, as shown in Figure 3, in the same way as we use sine and cosines waves in FT but now each wavelet has a weight (or coefficient) associated with it. If some of these coefficients are set to zero the waveform would appear to have straight line sections. Again similar to FT we can construct a family of waveforms of increasing frequency. So, starting with one, which fills the whole interval being considered (i.e. a spectrum), known as level 0, we move to level 1 by doubling the number of wavelets, which will be half the width of those on the previous level. Then to level 2, by again doubling the number of wavelets and so on. When we reach the seventh level it will contain 128, very narrow wavelets. This process may be continued to as high a level as is required for our application. An individual wavelet is specified by a level number and a position number. Figure 4 shows some S8 wavelets where the coefficient is non-zero for one or a few wavelets at each level. The labelling in brackets gives the level number and position of these wavelets.


Using wavelets for data compression in spectroscopy
When we use FT for data compression, the FFT program has to compute a coefficient for the sine and cosine waves at each frequency. For wavelet compression there is a similar FWT program but this has to compute coefficients for each wavelet at each level; so there is a rather larger file for each spectrum. Many of these coefficients will be very close to zero so there is a variable tolerance that can be set to make all the very small coefficients zero. This is where we obtain the data compression.
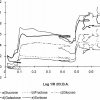
To see how this works in practice, Figure 5 shows the decomposition (the technical word for fitting a spectrum) of an NIR spectrum of polystyrene. The curves show very clearly that many coefficients were almost zero and those that are non-zero correspond to peaks in the original spectrum. One of the nice things about wavelets is that it is so easy to see where the information has been found. The lower levels (1–4) tend to be more generalised, required for accurate reconstruction of the spectrum but less interesting and not shown in the figure. The lowest curve in the figure is the reconstruction using all the wavelets.

Comparison of Fourier and wavelet compression
Between 1983 and 1988 TD and Professor Fred McClure3 developed an idea for a method of quantitative analysis, CARNAC, which did not rely on regression analysis. A key part of the method was that it required compression of NIR databases and this was done by FT using the programs developed by McClure. When we became interested in wavelets it seemed a good idea to see if we could replace the compression step in CARNAC by wavelet compression. We found that we needed answers to two questions: “which wavelet is best for NIR spectra” and “are wavelets any better than FT?” Although some researchers had experimented with NIR data and wavelets these questions had not been answered. There seemed to be a general belief that any wavelet would be better than FT!
We did a study4 using a sub-set of 12 NIR spectra selected from a large database of spectra of different chemicals and commodities supplied by Karl Norris.5 The sub-set was selected to give us a large variation in spectral shapes from smooth curves to sharp peaks and different mixtures of both. First, we tested the wavelets shown in Figure 2 to see if there was a “best” wavelet for use with NIR spectra. Best was defined as the wavelet that required the least number of coefficients to achieve a given degree of fit. In this case we knew the noise level of the spectrometer, 200 µA,† that had been used to measure these samples and (as the there is no point in trying to fit noise) this figure was used as the target for the compression. The results were judged by computing a reconstruction error for a given number of coefficients by subtracting the original spectrum from the reconstructions and calculating the root mean square across all wavelengths. We found that the best wavelets were: db3,db4,db5 and sy3,sy4,sy5, and we choose the db4 wavelet (which had been successfully used in other published work) for the comparison with FT. We had expected that the wavelet compression would be far more efficient than FT but this was not what we found. For 10 out of 12 spectra the wavelets were more efficient but the improvements were modest and in two cases, with very smooth spectra, the FT was superior. These variations are demonstrated by Figures 6 and 7 which show the reconstruction errors for water and freeze-dried coffee.


Conclusion
Wavelet compression is an interesting and popular method. However, when considering the application of wavelets for a new use, it is probably worth confirming that there is a useful advantage to be gained if compared to FT compression, rather than assuming that wavelets will always give a more efficient transformation. In spectroscopy, when information peaks are often well separated by regions of flat baseline we would expect that wavelets would be the better choice but for NIR spectra this is not the normal case and the decision is borderline. However, we decided to proceed with the application of wavelets to CARNAC and were rewarded with modest improvements compared to the use of FT compression with the same data.6 Further details of wavelet compression can be found in our book.7
References
- A.M.C. Davies, “The last furlong (1) Data Compression”, Spectroscopy Europe 25(2), 23 (2013).
- I. Daubechies, Ten Lectures on Wavelets. Society for Industrial and Applied Mathematics, Philadelphia, PA, USA.
- A.M.C. Davies, H.V. Britcher, J.G. Franklin, S.M. Ring, A. Grant and W.F. McClure, “The application of Fourier-transformed NIR spectra to quantitative analysis by comparison of similarity indices (CARNAC)”, Mikrochim. Acta (Wien) 1, 61 (1988). doi: 10.1007/BF01205839
- T. Fearn and A.M.C. Davies, “A comparison of Fourier and wavelet transforms in the processing of near infrared spectroscopic data: Part 1. Data compression”, J. Near Infrared Spectrosc. 11, 3–15 (2003). doi: 10.1255/jnirs.349
- P.C. Williams and K.H. Norris (Eds), Near Infrared Technology in the Agricultural and Food Industries. American Association of Cereal Chemists, St Paul (1987).
- A.M.C. Davies and T. Fearn, “Quantitative analysis via near infrared databases: comparison analysis using restructured near infrared and constituent data-deux (CARNAC-D)”, J. Near Infrared Spectrosc. 14, 403–411 (2006). doi: 10.1255/jnirs.712
- T. Næs, T. Isaksson, T. Fearn and T. Davies, A User Friendly Guide to Multivariate Calibration and Classification. NIR Publications, Chichester, Chapter 18, pp. 84–91 (2002).


