Antony N. Daviesa and Howard Markb
aSERC, Sustainable Environment Research Centre, Faculty of Computing, Engineering and Science, University of South Wales, UK. [email protected]
bThe Near Infrared Research Corporation, Suffern, NY 10901, USA. [email protected]
DOI: https://doi.org/10.1255/sew.2021.a6
© 2021 The Authors
Published under a Creative Commons BY-NC licence
A couple of columns ago we reported on work which had shown that weight fractions were often incorrect concentration units to use in quantitative chemometric studies.1 The article prompted some interesting feedback, not least a long “Letter to the Editor” from the originator of these ideas. His own work proving the importance of using volume fraction not weight fraction when the samples are made up of liquids of different densities had struggled to be published in chemistry journals. I was pleased that Howard had reached out to us from across the Atlantic, especially at a time of great upheaval in the USA, and with Ian Michael’s approval we have decided to feature Howard’s letter in this month’s column as it also sets straight a few misconceptions that were in our original look at this problem. So over to Howard!
Letter to the Editor—Howard Mark
Your column was a very nice review of the current status of investigations into the nature of “concentration” for spectroscopic analysis. I already knew about the “Mythbusters” article and some of the other articles you mention. But two are new to me: I had not previously heard of the work by Yan et al. and by the Analytical Methods Committee.2–3 So I want to thank you for bringing them to my attention.
To be sure, when wet chemistry was the premier method of chemical analysis, weight % was the natural, and indeed the best, basis for the analysis. It was the easiest, as well as the most precise and accurate, technology available to use; a standard analytical balance could weigh 100 g to 0.1 mg: 1 part in a million precision. It could be standardised by subjecting a specimen of pure analyte to the same analytical procedure used for “unknown” samples. Even nominally volumetric methods of analysis were usually converted to a weight basis for reporting. I never did that commercially, but when I was in school, “Analytical Chemistry” meant gravimetric and volumetric analysis.
So, it was always natural to use those gravimetric results as the “reference laboratory” values for spectroscopic analyses. Nobody thought there could be a problem aside from bad lab technique [key in “bad lab values” as one of the major problems for near infrared (NIR) spectroscopy]. Even when I had general thoughts to consider non-linearity effects on spectral results, I did not think how it would apply to the specific problems we had in understanding NIR spectra, or even that it could apply as described.4
“Mystery” non-linear phenomena?
I did, however, always have a nagging feeling in the back of my mind that some of the unexplainable phenomena we observe in calibrating for quantitative analysis using NIR spectra could be explained by invoking some “mystery” non-linear phenomenon. However, I had no clue, any more than anyone else, what the cause of that mystery could be—it was a mystery!
Everyone looked at the instruments, but the engineers did wonders in keeping non-linear effects out of the instruments, and any that remained were well-explained by known optical phenomena in the sources, optics, detectors and even the samples. Furthermore, there was never evidence for any of the effects I described in 1988 being present in analytical data. Sample effects were known [log (1/R)?, Kubelka–Munk? etc.) but calculations and experiments to elucidate these always gave the wrong order of magnitude to explain them.
The whole thing remained a mystery until I got a group together to do what amounted, almost by happenstance, to be the critical experiment that resolved the mystery. I didn’t expect that. My goal at that time was not to do any “great science” or even look for anything new. It was intended to be a tutorial, to use and explain and describe the classical least squares (CLS) algorithm. In fact, the work described in the 2010 Applied Spectroscopy paper5 was not the first time I tried it. I had previously done a similar experiment using water, ethanol and ethanoic acid. Those results were never formally published, but did see daylight in one of our columns.6 In fact, that whole set of columns and my textbook with Jerome Workman comprise a superset of information about the experiment and about my thoughts while figuring it all out.7,8
Severe spectral distortions due to interactions between mixture components
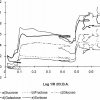
When using CLS, the “validation” step comprises predicting the spectrum of the mixture, and with a whole set of spectra, the spectra of the components of the mixture. Using water, ethanol and ethanoic acid to make up mixtures, the distortions of the spectra of the components are so severe that there Is no question that interactions are playing havoc with the results; there was no need to speculate about that. Dumb me: I should have known that, but I have been so far from chemistry, for so long that I forgot about hydrogen bonding!
However, as a tutorial about CLS, it was straightforward to set up an experiment that would minimise or eliminate all the known or suspected sources of error in NIR spectroscopy:
- Using clear miscible liquids removed effects due to optical scattering and inhomogeneity
- Measuring transmittance meant that Beer’s Law was the theoretically correct data treatment
- Mixture ingredients were all pure liquid hydrocarbons that should not interact [I wanted to use CCl4 (carbon tetrachloride) but good sense prevailed and we used methylene chloride and chloroform instead].
The ingredients were measured out gravimetrically, so there was essentially no error in knowing what was in the mixtures; importantly, there was no (conventional) “reference lab error”.
Fortunately, CLS was already preselected as the calibration algorithm, and it had the additional benefit of not requiring any user input of parameters, such as number of factors or number of wavelengths eliminating the risk of “overfitting”.
So, the experimental design was set, and (also importantly) there was no room for fudging the hardware, software or calibration. It was for a tutorial example, so it HAD to work! Nothing could go wrong...
Hydrogen bonding eliminated as a source of error, however…
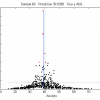
Imagine my shock when I saw as much as 20–25 % discrepancies between the spectroscopically measured values and the precisely known amounts of the ingredients!
Of course, the first thing we checked was the execution of the experiment, of which the first one was carried out by Ron Rubinovitz, a Senior Applications Scientist at Thermo Fisher Scientific. I told him about my results, we discussed the possibilities for errors in the experiment. Ron is a smart guy and a good experimentalist. He was able to convince me that he had all the potential experimental problems covered: I don’t even recall all the things he checked for, but I remember the precautions he took, for example, to prevent evaporation, and checking against that possibility by weighing the cell before and after making the optical measurements; also weighing the cell statically over (relatively) long periods of time to verify its integrity and freedom from leaks.
At that point my mind kept going round and round trying to figure out what could be wrong. Could it be the spectral measurements? No, the CLS algorithm was able to reconstruct the spectra of the mixtures very well. Could the computer be acting up and giving wrong answers? No, there was more than one computer used and they agreed on the results. Besides, when a computer goes bad, it does not just make small errors, the whole thing fails to work. The only thing not accounted for was the reference values, could that be it? No, I’ve already justified the precision and accuracy of the reference data. Everything was working properly—except the experiment! The mystery was showing its head.
Eliminating all other sources of error pointed to the wrong reference concentration values
With experimental errors eliminated, I had to believe that the spectroscopic values were correct. So, eventually, I narrowed it down to the question of were these the right reference values? Normally, when we apply chemometric algorithms, one of their properties touted is the way they automatically include any necessary scaling factors. But CLS doesn’t do that; recall “... there was no room to fudge the calibration”; CLS is the nearest thing we have to an “absolute” measurement method in spectroscopy. So that pointed the finger at not using the correct values to compare the calibration against.
But what, then, were the correct values? I had no idea. But I took it as a given that there had to be SOME physical property that was related to the absorption, otherwise all that I learned about science was out the window, and MAGIC was back in. By then all I could do was to generate other values, using known physics and chemistry to try out what could be correct.
Essentially the Edisonian approach; the details are in the Applied Spectroscopy paper.5 What gratified me most about tracking down the source of these discrepancies was that ever since I got involved with NIR spectroscopy, the technology, useful and important as it is, always seemed to exist in a universe of its own, separated from the rest of the scientific universe, and connected to it only by bunch of arcane mathematical formulae. As a scientist I knew there had to be more, but until I comprehended the results of this experiment, I could not figure out what that was.
After the (mental) dust settled I told Don Dahm (author of Interpreting Diffuse Reflectance and Transmittance: A Theoretical Introduction to Absorption Spectra of Scattering Materials) about my results and asked him what he thought.9 His response was “well, every physicist knows that!” Later I spoke to other physicists, who agreed with and even reinforced Don’s comments. It seems that Maxwell’s equations, the fundamental equations of electromagnetism that describe all the classical (i.e., pre-quantum mechanics) properties of light, are all derived on the basis of volume effects. Every physicist knows that! Here is the connection between NIR and the rest of the scientific universe. But that information never seemed to have made it to the chemists.
And the reason I’m writing at such length, is to correct misconceptions that always seem to creep into discussions about NIR spectroscopy. It seems that even chemometricians, who should know better, are subject to them, let alone chemists, who can be forgiven for them but who should still be corrected.
How errors enter chemometric equations
One primary issue is how errors enter into the chemometric equations. When Gauss derived his equations showing that Least Squares regression gave the same results as Maximum Likelihood calculations (which were the way relations between experimental data had previously been related), he also placed certain restrictions on how the data were to be handled. He specified that any errors affecting the relationship between the X (independent) variables and the Y (dependent) variable had to all be in the Y variable. The X variables should all be error-free. Modern discussions (e.g., my favourite book on the topic: Draper and Smith’s Applied Regression Analysis) of the topic analyse the effects of failing to adhere to Gauss’ prescriptions. It is not pretty.10
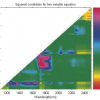
So, when I read your article, I could not help but note some misconceptions that continue to be promulgated. One of these is “The Great Mystery” of spectroscopy: why do quantitative spectroscopic measures of concentration go non-linear at higher concentrations? The answer to that question was immediately clear once I understood the results of my experiment. If two variables (weight fraction and volume fraction, in this case) are non-linear with respect to each other, then they cannot both be linearly related to any third variable.
Historically, quantitative analysis by wet chemistry was agnostic to the nature of the “reference value” because the reference standards used the same units as the samples. As discussed above, however, weight percents (or weight fractions) were overwhelmingly used in NIR analysis. But we were suddenly comparing those gravimetric measurements to a technology that was NOT agnostic, but had a built-in physics that required an inherently volume-based measurement (i.e., volume fractions).This made it clear to me that volume fractions were the “concentration” measure to use. This is irrespective of whether it “improves” calibration properties or not, it is still the correct units to express analyte concentrations in.
Above, I mentioned the separation of NIR analysis from the mainstream of scientific thought and effort. In particular, NIR spectroscopy has not conformed to the standard theoretical background that modern science is based on.
One other major misconception I found in your paper was where you stated “Howard selected CLS for his study, partly because it is the easiest chemometric model to explain...” While strictly speaking, saying that “CLS ... is the easiest chemometric model to explain” is a true statement; but that was NOT the reason I chose to use it.
The reason I chose CLS was because I wanted the experiment to conform to the limits of the physics involved, and not be “improved” (or disimproved) by the user’s choices. This way, it comprised a test of the conformance of NIR analysis technology to the rest of the universe of standard physics and science; then the discrepancies could point me in the right direction.
For say, 40 of the 45 years I’ve been concerned with NIR spectroscopy, I’ve been seeking the point of connection, so conducting an experiment where only the fundamental physical limits affected the results and the conformance of the NIR method to the rest of known science gave me confirmation that I was on the right track. I had little interest in producing the “best” calibration (in conventional terms of the Standard Error of Prediction or SEP); rather I wanted to gain understanding of how NIR spectroscopy works, as a piece of the scientific universe.
The world (and especially the NIR community) does not understand that approach. I have had papers rejected because I didn’t compute an SEP. Clearly the reviewers had no clue as to what was actually going on, “if it’s NIR there must be an SEP” was all that mattered in their world. I could have computed an SEP, which would have been a numerical measure of how well the CLS algorithm was “predicting” the pure ingredient spectra. The value of SEP would have been on the order of 10–4 to 10–5, but that number would have been meaningless in terms of any real knowledge about either NIR spectroscopy or its ability to perform analysis. A nice test of the CLS algorithm, though!
So, I seem to have run on at some length, and I’m not entirely sure what it’s all saying. So, let me just thank you again for publishing that review.
Conclusions
First of all, many thanks to Howard for explain much more deeply the history of this issue and his more thorough approach to reaching his conclusions… I’m very pleased we didn’t get too much wrong (!). And I want to thank Ian and Tony for affording me so much space to explain the meaning of those experimental results, and hope that other scientists can pick up the ball of Science and run with it, without being distracted by mathematics (important as it may be).
Everyone please, stay safe!
References
- A.N. Davies and H.-J. van Manen, “Weights or measures for better calibration”, Spectrosc. Europe 32(5), 22–24 (2020). https://www.spectroscopyeurope.com/td-column/weights-or-measures-better-calibration
- H. Yan, Y. Ma, Z. Xiong, H.W. Siesler, L. Qi and G. Zhang, “Quantitative analysis of organic liquid three-component systems: near-infrared transmission versus Raman spectroscopy, partial least squares versus classical least squares regression evaluation and volume versus weight percent concentration units”, Molecules 24(19), 3564 (2019). https://doi.org/10.3390/molecules24193564
- Analytical Methods Committee, AMCTB No 56, “What causes most errors in chemical analysis?”, Anal. Meth. 5, 2914–2915 (2013). https://doi.org/10.1039/C3AY90035E
- H. Mark, “Catalog of the effects of non-linearity on multivariate calibrations”, Appl. Spectrosc. 42(5), 832–844 (1988). https://doi.org/10.1366/0003702884429030
- H. Mark, R. Rubinovitz, D. Heaps, P. Gemperline and D. Dahm, “Comparison of the use of volume fractions with other measures of concentration for quantitative spectroscopic calibration using the classical least squares method”, Appl. Spectrosc. 64(9), 995–1006 (2010). https://doi.org/10.1366/000370210792434314
- H. Mark and J. Workman, “Classical least squares, part II: mathematical theory continued”, Spectroscopy 25(6), 20–25 (2010).
- Additional columns to be found in Spectroscopy Vol. 25 (5, 6 and 10), Vol. 26 (2, 5, 6 and 10) and Vol. 27 (2, 5, 6 and 10).
- H. Mark and J. Workman Jr, Chemometrics in Spectroscopy, 2nd Edn (2007). https://doi.org/10.1016/B978-0-12-374024-3.X5000-4
- D.J. Dahm and K.D. Dahm, Interpreting Diffuse Reflectance and Transmittance: A Theoretical Introduction to Absorption Spectroscopy of Scattering Materials. IM Publications (2007). ISBN: 978-1901019056. https://doi.org/10.1255/978-1-901019-05-6
- N.R. Draper and H. Smith, Applied Regression Analysis, 3rd Edn. Wiley (1998). ISBN: 978-0471170822
Howard Mark
After receiving the PhD degree from New York University, I got my first exposure to NIR when I joined Technicon Instrument Corp. in 1976. That was shortly after Karl Norris developed and made public his new technology, based on the use of the NIR spectral region, combined with reflectance measurements and computerised data analysis to extract the information contained in the data. I’ve been trying to understand how and why it works, ever since! After Technicon closed down, Howard became a consultant for the NIR industry, assisting in both instrument development and rendering applications assistance. He also wrote several books related to NIR and calibration development: Statistics in Spectroscopy, Principles and Practice of Spectroscopic Calibration, Chemometrics in Spectroscopy (Edns 1 & 2) as well as contributing several chapters to all four editions (4th Edn in press) of The Handbook of Near-Infrared Analysis.

Tony Davies
Tony Davies is a long-standing Spectroscopy Europe column editor and recognised thought leader on standardisation and regulatory compliance with a foot in both industrial and academic camps. He spent most of his working life in Germany and the Netherlands, most recently as Lead Scientist, Strategic Research Group – Measurement and Analytical Science at AkzoNobel/Nouryon Chemicals BV in the Netherlands. A strong advocate of the correct use of Open Innovation.