Guy Demortier
SPS and LARN, University of Namur and 61, rue de Bruxelles, B-5000 Namur, Belgium
DOI: https://doi.org/10.1255/sew.2021.a21
© 2021 The Author
Published under a Creative Commons BY-NC-ND licence
The presence of carbon clusters of size ranging between 5 µm and 50 µm in samples of the Khufu pyramid identified with a nuclear microprobe seems to indicate that they are of organic origin. Their location in the pyramid samples coincide with the position of other clusters containing sodium. This situation is completely absent in limestone samples collected from Egyptian quarries. The interpretation of the results could shed some light on the technique of construction of this huge monument.
Introduction
The interdisciplinary approach of the technique of construction of the Big Pyramids of Egypt is a subject of debate giving rise to passionate arguments. Increasingly, scientific teams are now being accepted on Egyptian sites to perform non-destructive investigations of monuments. Recent discoveries by Morishima and co-workers of large cavities in the Khufu’s pyramid using cosmic-ray muons1 have encouraged the Egyptian authorities to cooperate with Egyptologists around the World. The former reported length of the “big void” (around 30 m long) is now believed to be larger and continuous.2 The size of this void is so large that it is clear that all the surrounding structure must be highly rigid: this rigidity can only be achieved with perfectly overlapping blocks. Zahi Hawass, former minister of the Egyptian Antiquities who was initially sceptical about the Morishima’s conclusions of muon scans, is now ready to fully accept them and suggest that this void could be the location of the Khufu burial as reported in the Daily Express.3
Other ways to understand the mode of construction are to look at the structure of the monument as made by Bertho4 and by materials analysis as reported by Davidovits.5 These last two authors conclude that the monument was constructed with blocks moulded on site using local limestone and binder (to produce a kind of concrete) and not with hewn blocks. We have recently considered this point of view on the basis of the distribution maps of six major elements (C, O, Na, S, Cl and Ca) with a nuclear microprobe.6,7 This view is also supported by Barsoum et al. who have used various X-ray and electron microscopies to demonstrate that pyramid blocks contain calcium oxides and magnesium oxides with crystallographic structures which are not found in natural materials.8 Recent measurements of the orientation of iron compounds in pyramid samples using paleo-magnetic methods support the hypothesis of a man-made technique giving rise to a rapid solidification of mixed materials.9 In addition to the already reported elemental analysis of Na, S and Cl associated with natural limestone we present here a possible interpretation of abnormally incrusted 5–50 µm carbon clusters.
Experimental arrangement
Non-vacuum proton-induced X-ray emission (PIXE) and proton-induced gamma-ray emission (PIGE) analyses of Egyptian pyramid blocks with low-energy protons produced by electrostatic accelerators at the Universities of Namur and Lecce have shown abnormal concentrations of F, Na, S and Cl.10–12 More recently, micro-PIXE and micro-PIGE investigations with a (in vacuum) scanning nuclear microprobe at ATOMKI (Debrecen, Hungary) (Figure 1) have been performed to locally quantify the composition in lighter elements, down to carbon. The spatial resolution and uniformity of irradiation were regularly checked on a copper grid deposited on a carbon substrate during the analysis (Figure 2).
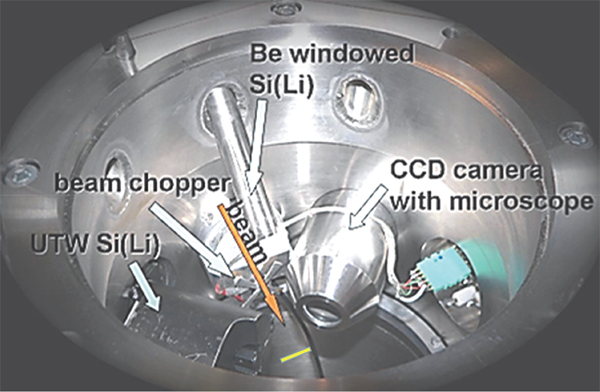
Figure 1. The PIXE microprobe chamber at Atomki (Debrecen, Hungary).
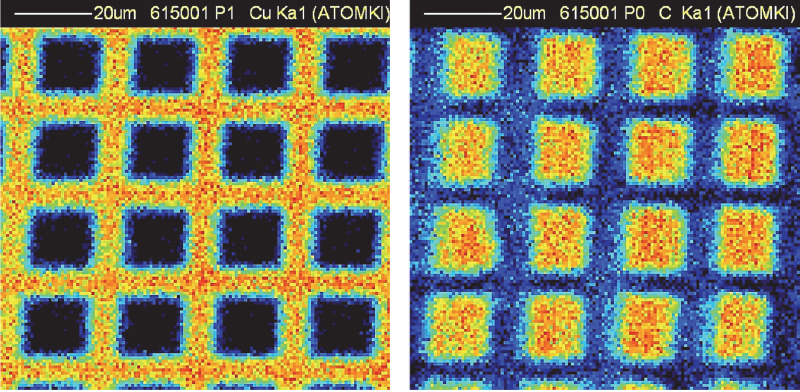
Figure 2. Micro-PIXE maps of a copper grid on a carbon substrate. Left: copper; data collected with the Be windowed detector). Right: carbon; data collected with the SUTW detector.
Samples were taken from the inside of chunks of Egyptian pyramid blocks and from stone in the limestone quarries of Tura and Maadi (north of Egypt). They were crushed and pressed to obtain flat circular pellets without any additional binder (Figure 3). The sampling process ensured that any contamination with foreign material was excluded. The flat surfaces were irradiated with protons at normal incidence with the following experimental conditions: 2.5 MeV proton beam focussed to a spot size of ~3 µm, beam current ~100–200 pA, size of the scanned region 1 × 1 mm2. The measurement times were typically ~500–900 s corresponding to ~0.1–0.2 µC accumulated charge.
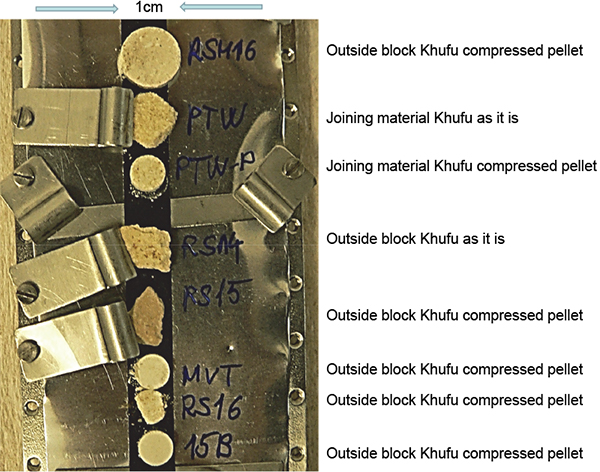
Figure 3. Pellet samples on their target holder.
Incident 2.5 MeV protons offer a maximum cross-section (100 %) for K-shell ionisation of Al; 61 %, 84 %, 93 %, 98 %, 99.5 % for K-shell ionisation of C, O, F, Na, Mg and F, respectively (region of decreasing slope of the K-shell ionisation cross-section at Ep = 2.5 MeV); and 87 %, 80 %, 73 %, 60 % and 53 %, respectively, for Si, P, Cl, K and Ca (region of increasing slope of the K-shell ionisation cross-section). This choice of proton energy is optimum to partially compensate for the unavoidable loss of low-energy X-ray signals from light elements (277 eV for CKα to 1.25 keV for MgKα) in the material, since the K-shell ionisation cross-section increases as protons enter deeper into matter. The information depth for CKα, OKα and CaKα X-ray lines in pure CaCO3 is given in Figure 4.
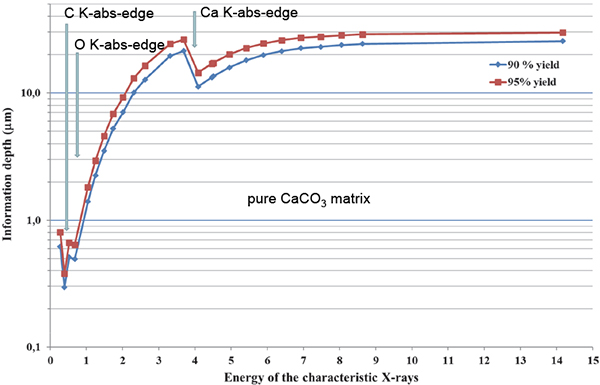
Figure 4. Information depth for C, O and Ca in CaCO3.
The micro-PIXE detection setup consisted of a super ultra-thin windowed (SUTW) Si(Li) X-ray detector and a Be-windowed detector which were operated simultaneously, allowing the efficient detection of light elements down to carbon (in the 0.28–8 keV range) as well as heavier ones (from K upwards), respectively. The SUTW detector was protected from backscattered particles with a permanent magnetic unit. In the case of the Be-windowed detector (solid angle ~100 msr) the intense soft characteristic x-rays (<3 keV) were attenuated with a Kapton® filter (375 µm thick). Characteristic X-ray spectra of samples were evaluated and elemental compositions were determined with the PIXEKLM-TPI (Atomki) software package.13 With this, the K, L (and M) characteristic lines of elements from CKα upwards as well as escape and pile-up peaks present in the spectra are fitted. However, elemental concentrations are calculated from the Kα or Lα X-ray intensities of elements, considering the absorption-enhancement effects for characteristic X-rays within the samples as well as experimental parameters (proton beam energy, detector solid angle, X-ray filters etc.) as described in References 13 and 14. The micro-PIGE setup consisted of a NaI(Tl) detector (diam. = 110 mm) placed outside the vacuum chamber at 90 ° relative to the direction of the beam. It was chosen for the detection of the 6>–7.1 MeV γ-ray group of the 19F(p,αγ)16O nuclear reaction, because FKα (677 eV) detection in the SUTW detector could indeed suffer from partial interference with the Lα line of Fe (705 eV): iron is indeed present in all the analysed samples.
The whole measurement procedure was calibrated and tested thoroughly with standard reference materials (RMs), e.g. NIST 610, “Corning D” archaeological glass and some home-made RMs, as well as pure chemical compounds such as quartz, NaCl etc. On average, ~5–10 rel. % accuracy can be achieved for the concentrations of major and minor elements and 10–20 rel. % for the trace element data.
Selected X-ray spectra of RMs, quarry and pyramid samples are given in Figures 5–7.
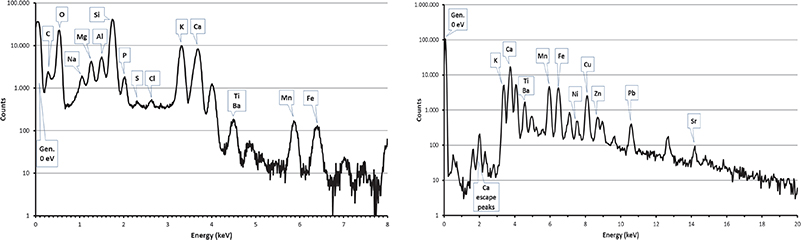
Figure 5. PIXE spectra collected by SUTW detector (left) and Be-windowed detector (right) on the homogeneous Corning reference material.
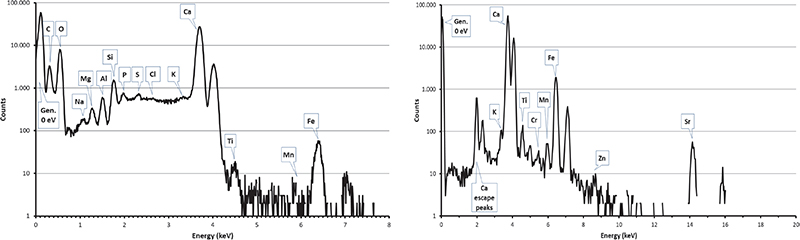
Figure 6. PIXE spectra collected by SUTW detector (left) and Be-windowed detector (right) on a limestone sample from Maadi quarry.
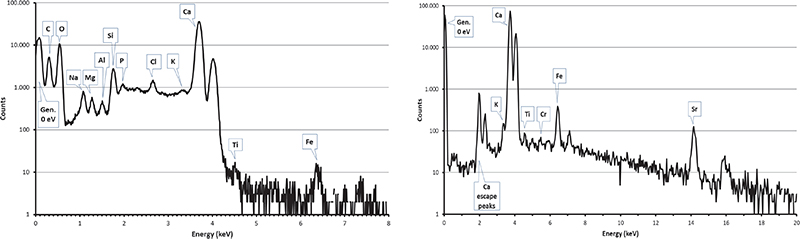
Figure 7. PIXE spectra collected by SUTW detector (left) and Be-windowed detector (right) on a sample of the external block of the Khufu pyramid.
Micro-PIXE analysis of Egyptian pyramid blocks
The choice of the positions of the SUTW and Be-windowed detectors installed on either side of the proton beam direction (see Figure 1) was essential to check the uniformity of the irradiated surface. In order to avoid any misinterpretation of the collected X-ray maps, it was necessary to be sure that the structure of the CaKα maps was the same in both detectors. Shadowing effects due to potential irregularities along the pellet surface would give rise to signal loss of X-rays emitted by the lightest elements. It is shown in Figure 8 that both CaKα maps are similar for homogeneous (quarry) and for non-homogeneous (pyramid) samples. The CaKα maps collected in both detectors are similar but not identical in their intensity (counts are less important in the Be-windowed detector than in the SUTW detector which covers a higher solid angle). It can be seen that a Si cluster takes the place of Ca in the top maps (Tura quarry). In the middle maps (an outside block from the Khufu pyramid), clusters of Na and S are present in those regions missing Ca. For the bottom maps (an outside block from the Khaphra pyramid), large Na clusters are present. These Na clusters have a very irregular shape that induces some apparent fuzziness which is certainly not due to the proton beam being out of focus, but to large variations of thickness at their edges.
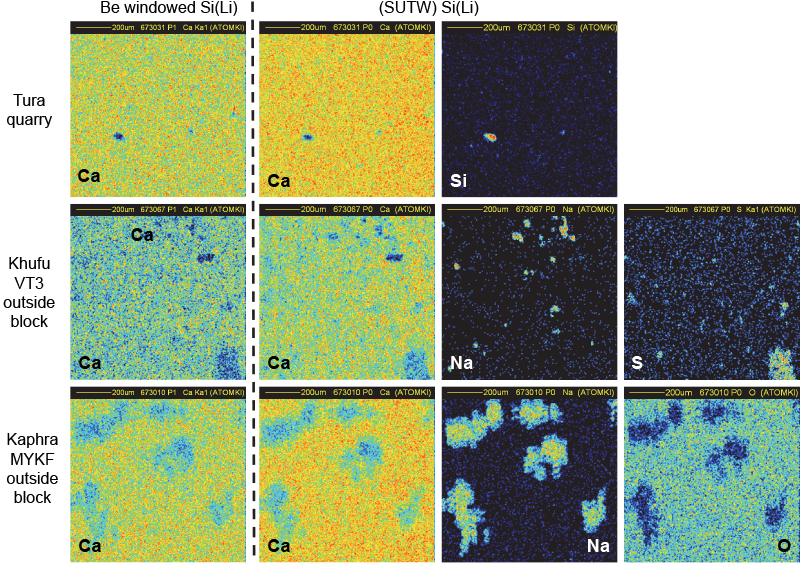
Figure 8. Flatness check of pellet samples by comparison of CaKα maps in both detectors.
The spatial distribution of all the elements is uniform in all quarry samples (Figures 9 and 10). Small inclusions (around 15–30 µm in diameter) of Al, Si and Fe can also be observed in addition to nearly pure calcium carbonate (C, O and Ca maps). Traces of Na, Mg, P, S, Cl and K show no specific spatial distribution. The elemental concentrations in Ca, Mg, Al and Si were combined with the appropriate O concentration to obtain the most probable chemical compounds: CaCO3, MgO, Al2O3 and SiO2.
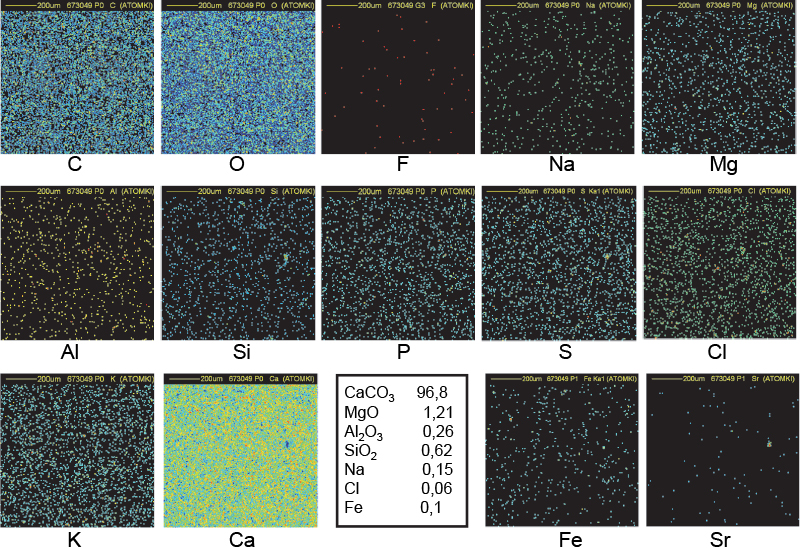
Figure 9. Distribution maps of 14 elements in Tura quarry sample (1 mm × 1 mm).
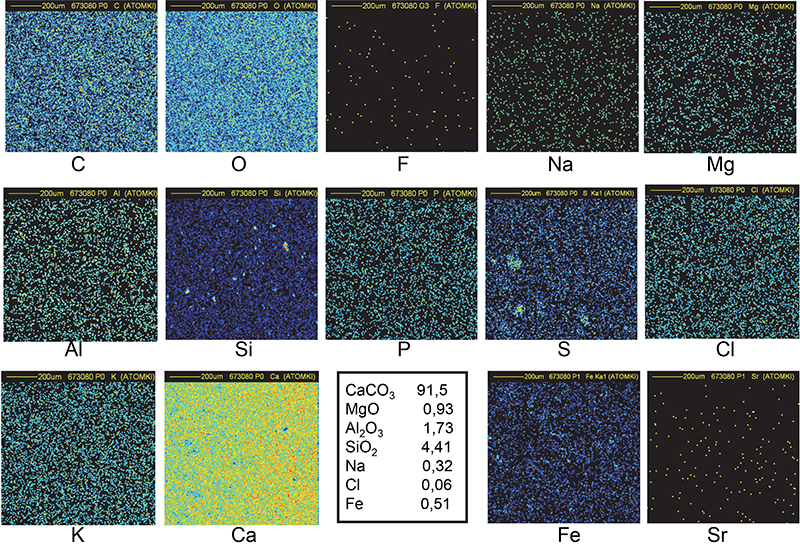
Figure 10. Distribution maps of 14 elements in Maadi quarry sample (1 mm × 1 mm).
On the contrary, the distribution is very non-homogeneous in most of the pyramid samples, as shown in Figures 11–14. Beside abundant calcium carbonate, there are inclusions (about 20 µm wide or larger) of Na, Cl and/or S which are correlated with a lack of Ca and O. Sodium and chlorine (about 4–6 % and sometimes more) are systematically correlated and could at first sight be interpreted as inclusions of sodium chloride. Nevertheless, the Na signal is always higher than what is needed to form NaCl (as confirmed by measurements on RMs). At the sites of high concentrations of Na and Cl, the Ca and O concentrations are less than in the surrounding area. Considering that the oxygen content in Na2O and H2O is lower than in CaCO3, it may be concluded that Na2O (certainly with some H2O) is mixed into the NaCl clusters. Magnesium, phosphorus and potassium are also more abundant in the pyramid samples than in the quarry samples, but they are not distributed in the clusters.6,7 Their presence may be attributed to ashes used to create the binder with a high chemical pH induced by Na2O and H2O.15 Reported concentrations in Figures 10–14 have been computed with the data collected in different regions of several irradiated samples (6–10 different locations) and do not only refer to the specific map. Beside calcium and magnesium oxides, it is known that wood ash contains small quantities of oxides of phosphorus, potassium, manganese and iron.7
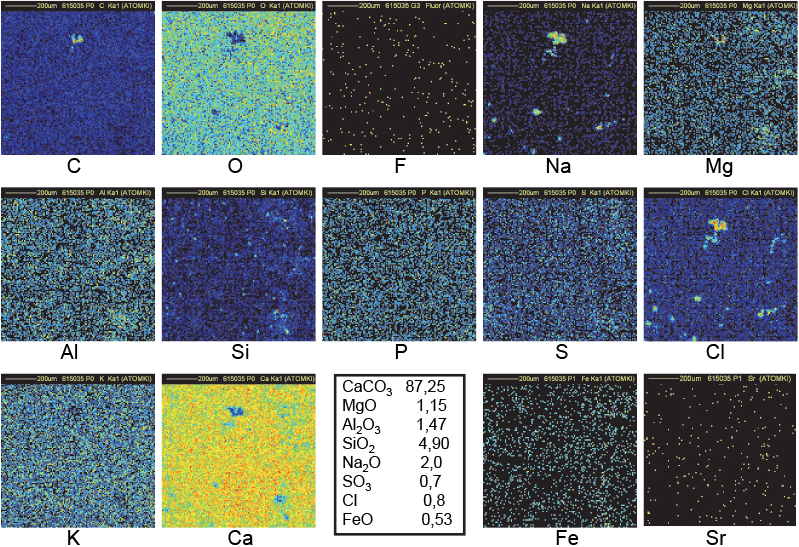
Figure 11. Distribution maps of 14 elements in FH123 Khufu Great Gallery sample (1 mm × 1 mm).
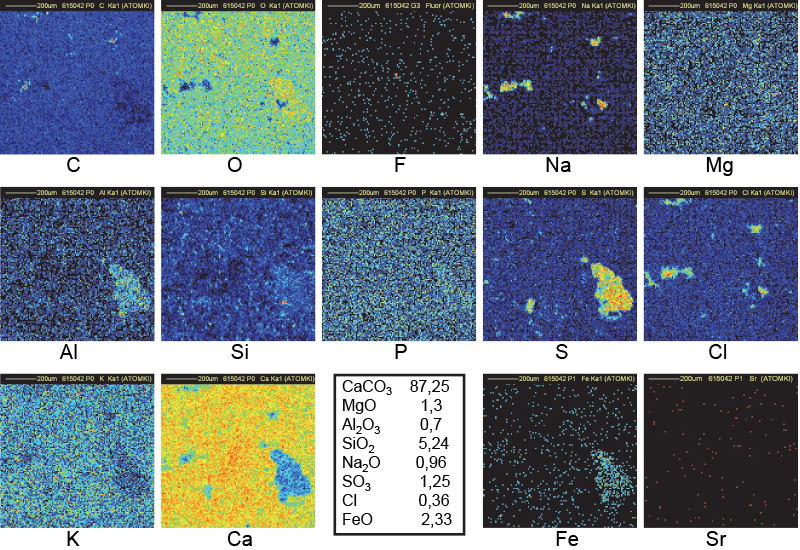
Figure 12. Distribution maps of 14 elements in VT3 outside block of Khufu (1 mm × 1 mm).
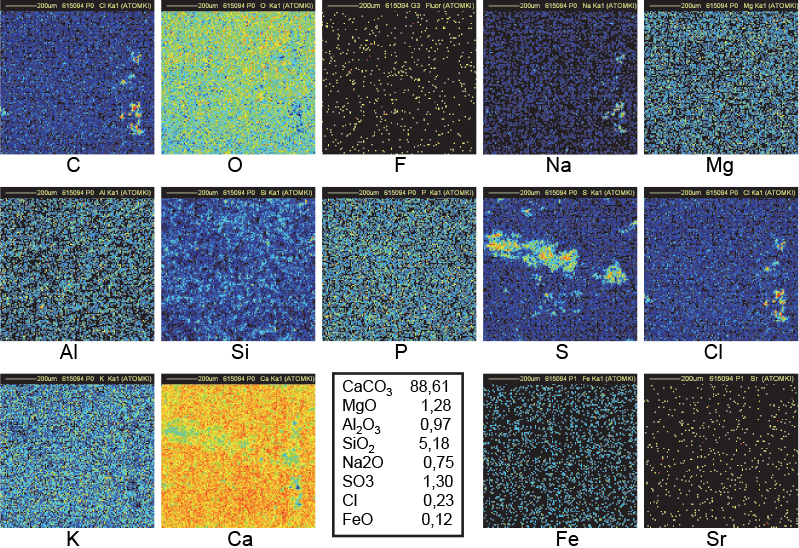
Figure 13. Distribution maps of 14 elements in 15a outside block of Khufu (1 mm × 1 mm).
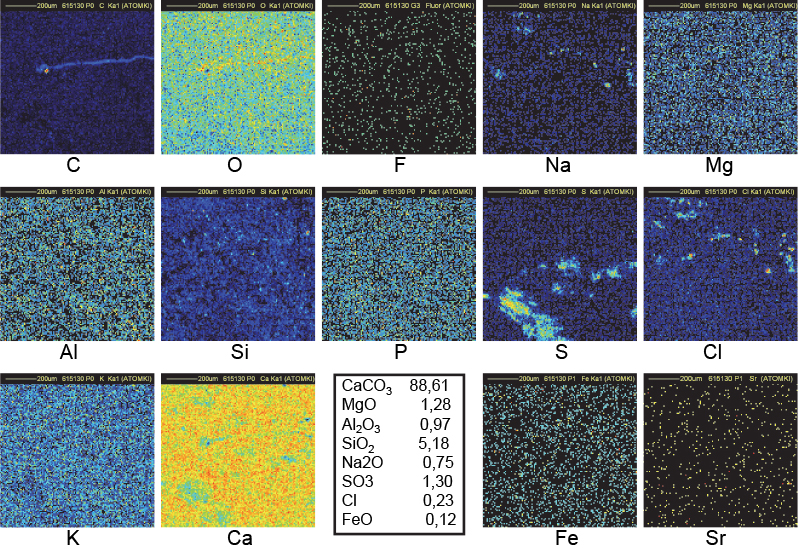
Figure 14. Distribution maps of 14 elements in 15b outside block of Khufu (1 mm × 1 mm).
Carbon clusters
Carbon clusters have been observed on elemental maps collected on numerous (but not all) pyramid samples, but never on maps from Maadi and Tura quarry samples (see Figures 6 and 7) or in other natural limestone samples from Belgium, Hungary and Saqqarah which were analysed in the complete microprobe runs (more than 150 maps).6,7,16
The carbon maps refer to the detection of the low-energy (277 eV) Kα line by the SUTW detector. This low energy CKα line, induced in pure CaCO3 by 2.5 MeV protons, cannot reach the detector if its production is deeper than 1 µm below the surface (see Figure 4). However, if the carbon belongs to some organic compound, the information depth may be 5–10 times higher. Therefore, CKα could have been produced deeper which would explain the hole in the corresponding Ca map.
The maps in Figure 12 refer to sample FH123 collected in the Great Gallery of the Khufu Pyramid. A bright spot in the C map, correlated to black spots in both Ca and O maps as shown in the central upper part of maps, indicates that the CKα line is produced deeper than 1 µm below the surface. The volume of that C-rich region covering a surface of 25 µm × 25 µm could extend down to 10–20 µm below the surface. In addition, this region corresponds also to the region of both Na and Cl clusters: a probable signature of the use of natron (a naturally occurring mixture of hydrated sodium carbonate: Na2CO3 • 10H2O with some sodium chloride and sodium sulfate). All these observations fit with the model of construction created by Davidovits, who states that the blocks of Khufu pyramid were cast in situ using granular limestone aggregates, natron, lime (probably produced by the combustion of wood in domestic fires) and water to produce an alkali alumino–silicate based binder.15 The black spot in the bottom-left part of the O map coincides with the bright spots in the Na and Cl maps: the O content is indeed lower in Na2O than in CaCO3. The black spot in the bottom-right of the Ca map corresponds to the bright spot in the Si map: a small amount of SiO2 is common in natural limestone as is also observed in the distribution maps of Figures 6 and 7.
A similar interpretation may be given for sample VT3 (an outside block from Khufu) for C, O, Na, Cl and Ca maps (Figure 13). Additional large clusters of Al, S and Fe justify the black spots in the Ca map.
Clusters of C in Figure 14 (sample 15B, an outside block from the Khufu pyramid) fully correlated with Na and Cl clusters may be understood as discussed immediately above, but no clear decrease is observed in the corresponding Ca region. The C clusters are thinner than in Figure 12. C, Na and Cl clusters are then concentrated closer to the surface allowing a better transmission of CaKα lines to explain the better uniformity in the Ca map. The holes in the O map are in good correspondence with the clusters in the C, Na and Cl maps. The C map of Figure 14 (same sample 15B but another fragment) shows a filament-shaped distribution suggesting an organic origin.
Conclusion
Elemental distribution maps of C, O, Na, S, Cl and Ca clearly indicate that the structure of the samples of the Khufu pyramid is not homogeneous and is completely different from samples from the Maadi and Tura quarries. The amount of natural limestone in pyramid samples is about 5–10 % less than in samples from the quarries. The other elements, like Na, S and Cl, are mainly distributed in clusters. The mean concentration of Mg is higher in the pyramid samples, but this element is in general homogeneously distributed. Abnormal clusters of C with size varying from 5 µm to 30 µm are interpreted as from an organic origin. These structural and compositional observations fit with the model of construction involving a moulding procedure.
It would be certainly important to understand why carbon is distributed in clusters. 14C dating would be the best way to check this. If the C clusters observed by micro-PIXE originate from pollution, their 14C/12C ratio would be the same as that for modern wood. If this ratio is lower by a factor of two (T½ of C14 is indeed very close to the reported age of the Giza pyramids!), the interpretation would suggest the use of some organic material during the construction of the pyramid. A 14C : 12C ratio close to zero would mean that carbon is of geological age. As it is difficult to perform 14C dating on very small samples like those used in the present study, sampling with the agreement of the Egyptian authorities could allow the appropriate quantity of material to be provided to experts in accelerator 14C dating. The conclusions of 14C dating would help lift the veil of mystery of the construction of the Egyptian pyramids.
Acknowledgements
I am indebted to the scientific and technical staff of LARN (Namur, Belgium) and ATOMKI (Debrecen, Hungary) for their important support during the long runs of measurements. My special thanks to Prof. Á.Z. Kiss and Dr I. Uzonyi for fruitful advice and their valuable suggestions concerning the nuclear microprobe equipment.
References
- K. Morishima, M. Kuno, A. Nishio, N. Kitagawa, Y. Manabe, M. Moto, F. Takasaki, H. Fujii, K. Satoh, H. Kodama, K. Hayashi, Sh. Odaka, S. Procureur, D. Attié, S. Bouteille, D. Calvet, Chr. Filosa, P. Magnier, I. Mandjavidze, M. Riallot, B. Marini, P. Gable, Y. Date, M. Sigiura, Y. Elshayeb, T. Elnady, M. Ezzy, E. Guerriero, V. Steiger, N. Serikoff, J.-B. Mouret, B. Charlès, H. Hedal and M. Tayoubi, “Discovery of a big void in Khufu’s pyramid by observation of cosmic-ray muons”, Nature 552, 386 (2017). https://doi.org/10.1038/nature24647
- I. Arnaud, “Pyramide de Khéops: la cavité inconnue s’avère encore plus longue”, Sci. Avenir 887 (2019).
- C. Hoare, “Egypt experts set sights on finding lost Pharaoh’s remains in Great Pyramid“, Daily Express 14 November 2019. https://www.express.co.uk/news/world/1203221/egypt-khufu-found-void-scanpyramid-great-pyramid-giza-zahi-hawass-tutankhamun-saatchi-spt
- J. Bertho, La Pyramide Reconstituée: Les Mystères des Bâtisseurs Égyptiens Révélés. Editions Unic, Saint-Geoges-d’Orques, France (2001).
- J. Davidovits, “X-ray analysis and X-ray diffraction of casing stones from the pyramids of Egypt, and the limestone of the associated quarries”, Science In Egyptology Symposia, pp. 511–520 (1984).
- G. Demortier, “Distribution of sodium and chlorine in samples of Egyptian pyramids”, Geopolym. Archaeol. 1, 1–9 (2020). https://doi.org/10.13140/RG.2.2.33958.75844
- G. Demortier, “Scanning micro-PIXE analysis of samples of Egyptian pyramids for a global approach of work involved in their construction”, Curr. Top. Anal. Chem. 12, 15–32 (2020). https://doi.org/10.1111/j.1551-2916.2006.01308.x
- M. Barsoum, A. Ganguly and G. Hug, “Microstructural evidence of reconstituted limestone blocks in the Great Pyramids of Egypt”, J. Am. Ceram. Soc. 89(12), 3796–3788 (2006).
- I. Túnyi and I.A. El-hemaly, “Paleomagnetic investigation of the great Egyptian pyramids”, Europhys. News 43(6), 28–31 (2012). https://doi.org/10.1051/epn/2012604
- G. Demortier, “PIXE, PIGE and NMR study of the masonry of the pyramid of Cheops at Giza”, Nucl. Instrum. Meth. B 226, 98 (2004). https://doi.org/10.1016/j.nimb.2004.02.024
- G. Demortier, G. Quarta, K. Butalag, M. D’Elia and L. Calcagnile, X-Ray Spectrom. 37, 178 (2008). https://doi.org/10.1002/xrs.1059
- G. Demortier, “Revisiting the construction of Egyptian pyramids”, Europhys. News 40(1), 28 (2009). https://doi.org/10.1051/epn/2009303
- Gy. Szabó and I. Borbély-Kiss, “PIXYKLM computer package for PIXE analyses”, Nucl. Instrum. Meth. B 75, 123 (1993). https://doi.org/10.1016/0168-583X(93)95626-G
- I. Uzonyi, Gy. Szabó, “PIXEKLM-TPI—a software package for quantitative elemental imaging with nuclear microprobe”, Nucl. Instrum. Meth. B 231, 156–161 (2005). https://doi.org/10.1016/j.nimb.2005.01.050
- J. Davidovits and M. Morris, The Pyramids, an Enigma Solved. Hippocrene Books, New York (1988).
- G. Demortier, “La microsonde à protons pour percer le mystère de la construction de la pyramide de Khéops”, Revue Quest. Sci. 188(1), 1–112 (2017). https://www.rqs.be/app/views/revue.php?id=5

Guy Demortier
Guy Demortier has a PhD in nuclear physics, is Emeritus Professor of Physics at University of Namur, Belgium, Co-founder and past director of LARN (Laboratoire d’Analyses par Réactions Nucléaires), Past-president of the Belgian Physical Society, Past-president of COST Action G1 (Ion beam study of art and archaeological objects) and First winner of the EPS-IBA-Europhysics Prize for Applied Nuclear Science and Nuclear Methods in Medicine. His research fields include nuclear properties of light nuclei, neutron physics, accelerator-based methods of elemental analysis (PIXE, PIGE, RBS, RNA, XRF induced by PIXE, nuclear microprobe), and applications in materials science, archaeometry, ancient gold metallurgy, dentistry and supraconductors. 0000-0001-6834-6866
[email protected]